General App Insights Guidelines
Overview
App Insights is a useful tool for monitoring overall system health and diagnosing dependency failures.
Note
Sometimes App Insights will surface internal Azure behaviour that may appear as errors or dependency failures but are expected and harmless. These can obscure real issues if not understood.
Some examples: - Dependency Failure when accessing a resource - Dependency Failure BlobContainerClient.CreateIfNotExists
Guidance
- Review dependency failure details and check whether a retry shortly afterwards succeeded — often a token refresh or transient condition.
- Use caution when suppressing errors in telemetry; ensure you are not hiding actionable failures.
Inspecting failures in Application Insights
Follow these steps to open failure details, view the end-to-end call trail, and examine traces:
- Open the Azure Portal and navigate to the Application Insights resource for the affected app.
- In the left-hand menu, under Investigate, click Failures.
- Set the time range in the upper-right to cover the incident window.
- Choose the failure type to inspect: Failed requests or Exceptions. Use the filters (operation name, response code, cloud role) to narrow results.
- Click a data point in the chart or an entry in the failures list to see examples. Then open an example instance.
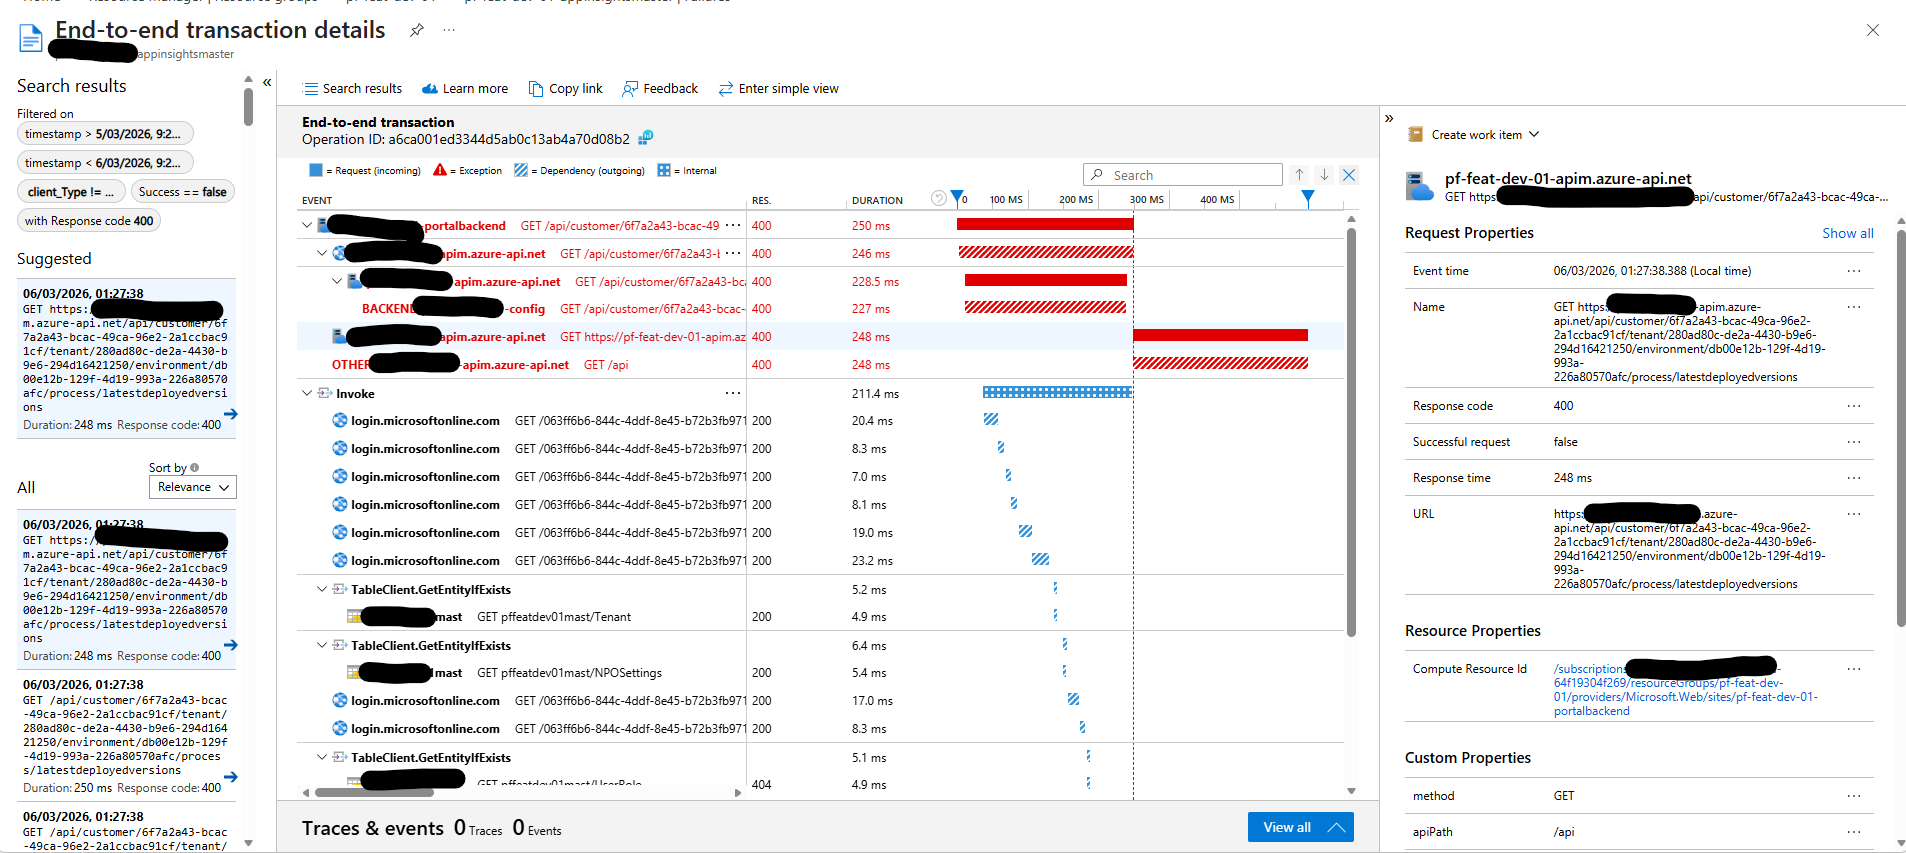
- The example opens the end-to-end operation view (transaction details). Use the following panes:
- Summary/Properties: basic metadata (operation, user, duration, timestamp).
- Timeline / Events: shows the chronological call trail (requests, dependencies, exceptions, custom events).
- Dependencies: external calls (HTTP, SQL, storage) invoked by the operation.
- Traces: related log messages captured during the operation — useful for contextual debug messages and stack traces.
- From the operation view you can open the full telemetry item in Search (or Logs) to see raw JSON and any additional linked telemetry (click the item to expand).
- If you need to run queries, click Logs to open Kusto Query Explorer and query across requests, dependencies, exceptions, and traces. Typical useful queries:
- correlate by
operation_Idto get the full call trail - join
requests,dependencies,exceptions, andtracesonoperation_Idfor a complete picture
- correlate by
Tips:
- Always set the correct time range before filtering.
- Use the operation_Id from the request or exception to correlate related telemetry.
- Export or copy the operation details when sharing with the engineering team.
Verification checklist
- [ ] Telemetry reviewed for transient vs persistent failures
- [ ] Suppression rules documented and approved